

Epidemic curve, common intermittent source

Epidemic curve, common intermittent source
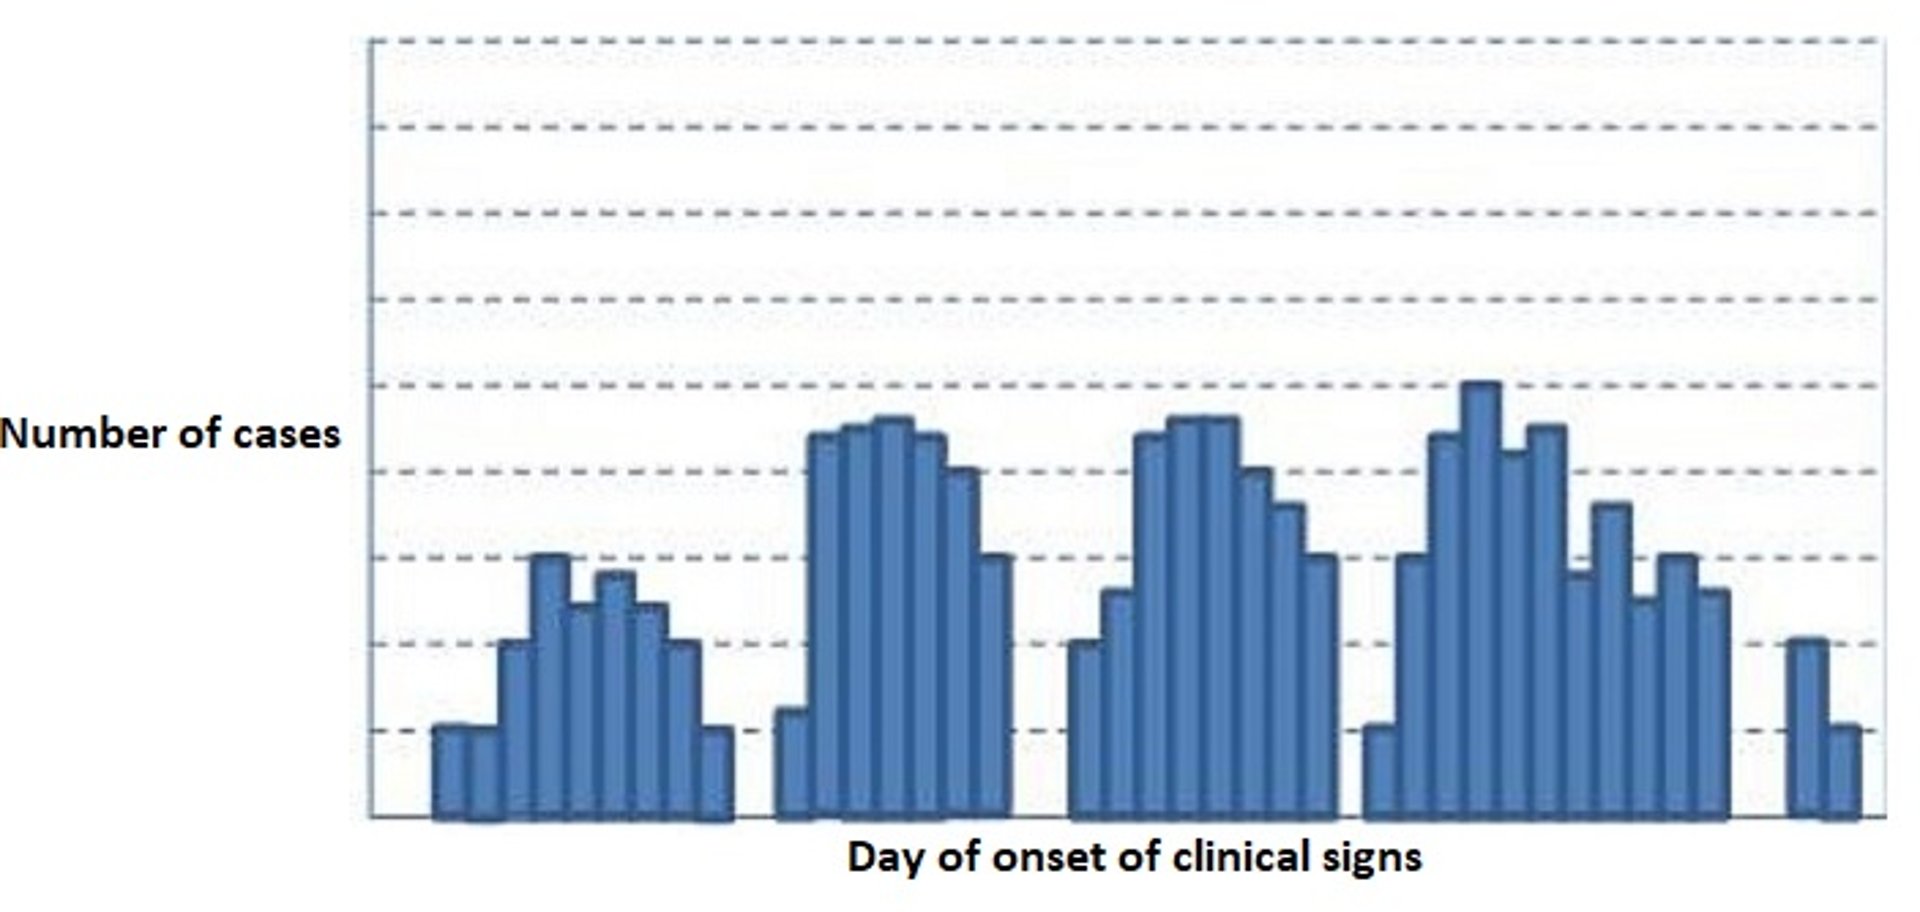
Epidemic curve for a hypothetical common source outbreak with intermittent exposure (eg, intermittent access to a play yard contaminated with roundworm and hookworm eggs). Case numbers peak at irregular times corresponding to the earlier exposures. The x-axis represents the day of onset of clinical signs and the y-axis represents the number of cases.
Courtesy of Dr. Donald L. Noah.
In these topics